

Technical cleanliness: identifying particles with LIBS and Raman
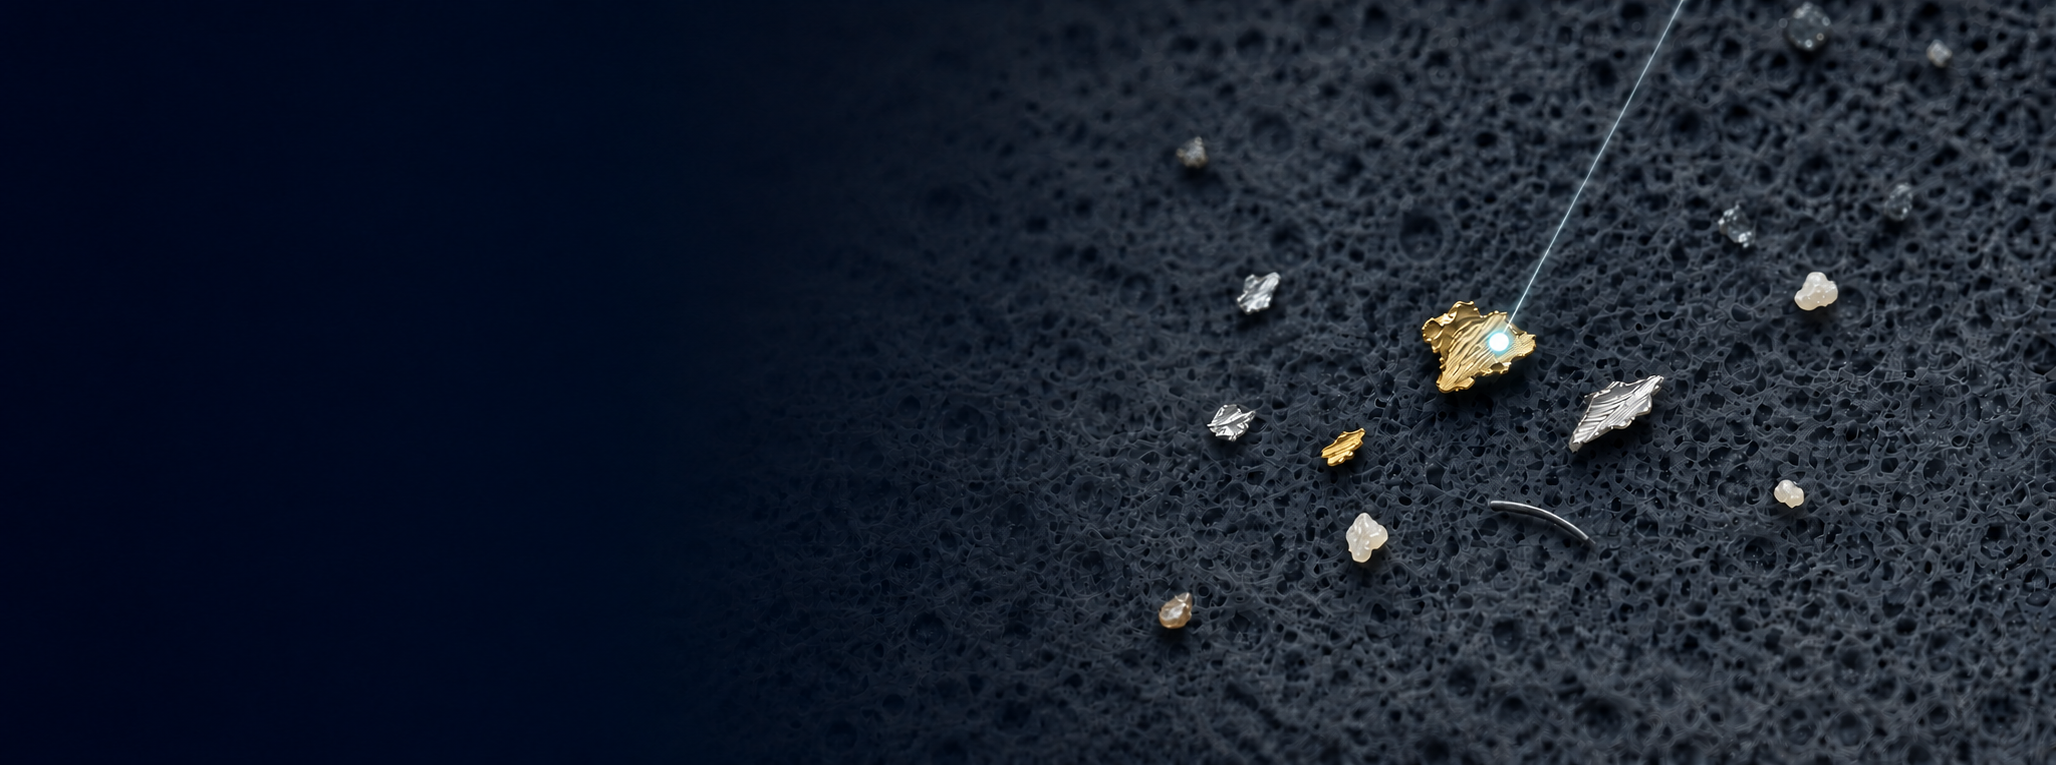
Metal wear debris, mineral residues or plastic particles: identifying the material can help narrow down potential sources of contamination. CORALIS combines optical imaging with LIBS and Raman spectroscopy to characterise selected particles.
Find out what each analytical method in CORALIS reveals and how LIBS can be used to classify metallic grains.
Why is particle identification important?
Particles on components can impair the performance and shorten the service life of sensitive systems. Depending on their size, material and application, particles can increase wear, clog fine channels or damage sealing surfaces. Conductive fragments can also cause short circuits in electrical assemblies. Technical cleanliness is therefore an important part of quality assurance.
Alongside particle count and size, material composition is particularly useful. Optical inspection reveals which particles are present and what they look like. Material analysis helps distinguish metal wear debris from mineral residues or polymer contaminants. Even fragments that look alike can be made of different materials and point to different causes.
Particle identification can help narrow down potential sources of contamination during manufacturing and assembly. If the alloying elements in a metallic grain or shaving match those in a tool or component, for example, that possible link can be investigated further. Composition alone does not establish the source; process conditions and other findings must also be considered.
Combining LIBS and Raman spectroscopy provides complementary information on the elemental composition and molecular structure of suitable grains. This supports root cause analysis and helps target improvements in machining, cleaning, handling or assembly.
What information does the analysis provide?

Detect particles
A microscope image reveals the fragments and helps select measurement locations.

Determine particle size and count
Image analysis provides the count, size and size distribution of the detected fragments.
Characterise the material
LIBS and Raman provide complementary information on elements and molecular structures.
How does particle analysis with CORALIS work?
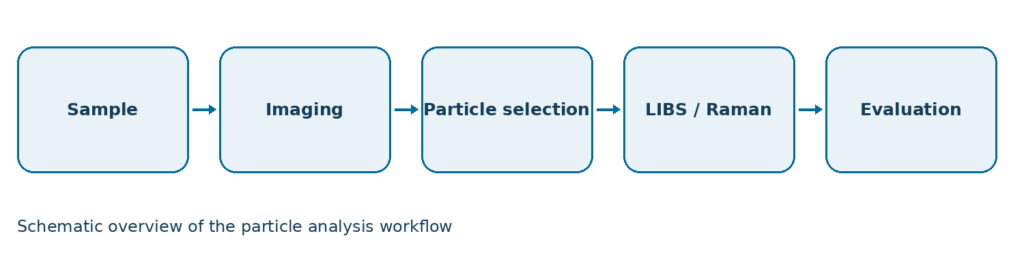
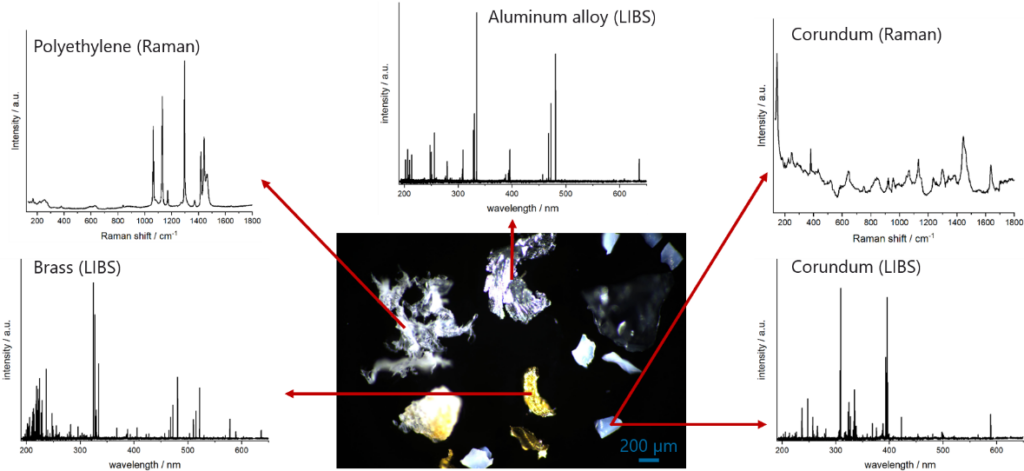
A microscope image of the sample is used to detect fragments and select measurement locations. Selected fragments can then be analysed with LIBS, Raman or both methods in sequence. Sample preparation and measurement strategy depend on the sample and the analytical question.
LIBS and Raman: two complementary methods
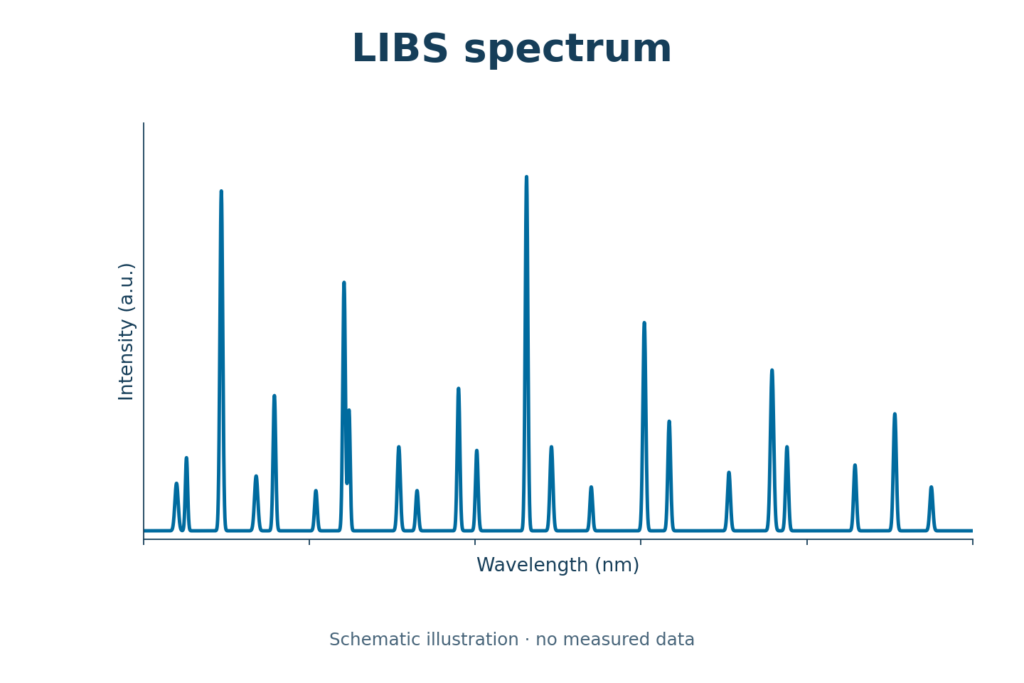
LIBS: Which elements are present?
A laser pulse generates a plasma. Its light contains characteristic information about the elements at the measurement site. LIBS is suitable for analysing metallic shavings or fragments and their alloying elements, among other applications.
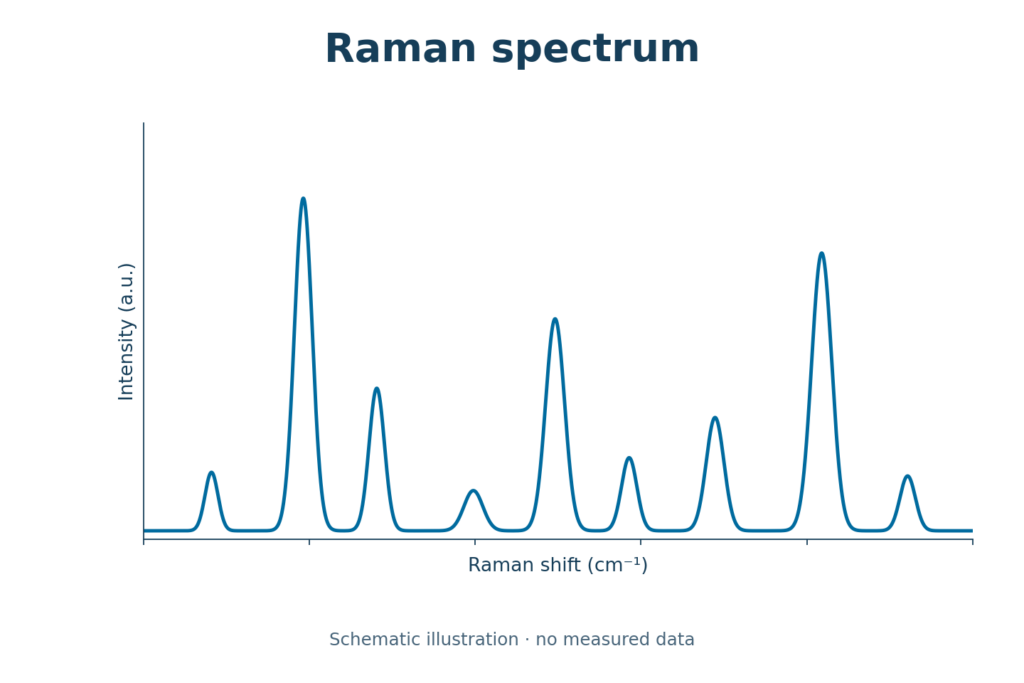
Raman: Which structures are present?
Raman spectroscopy provides information on molecular vibrations and crystalline structures. It can help identify suitable polymers and minerals.
How is a Raman spectrum interpreted?
Measured Raman spectra can be compared with reference spectra to help identify a material. Characteristic band positions and the overall spectral pattern provide clues to molecular and crystalline structures. The reliability of the assignment depends in part on signal quality and the availability of suitable reference data.
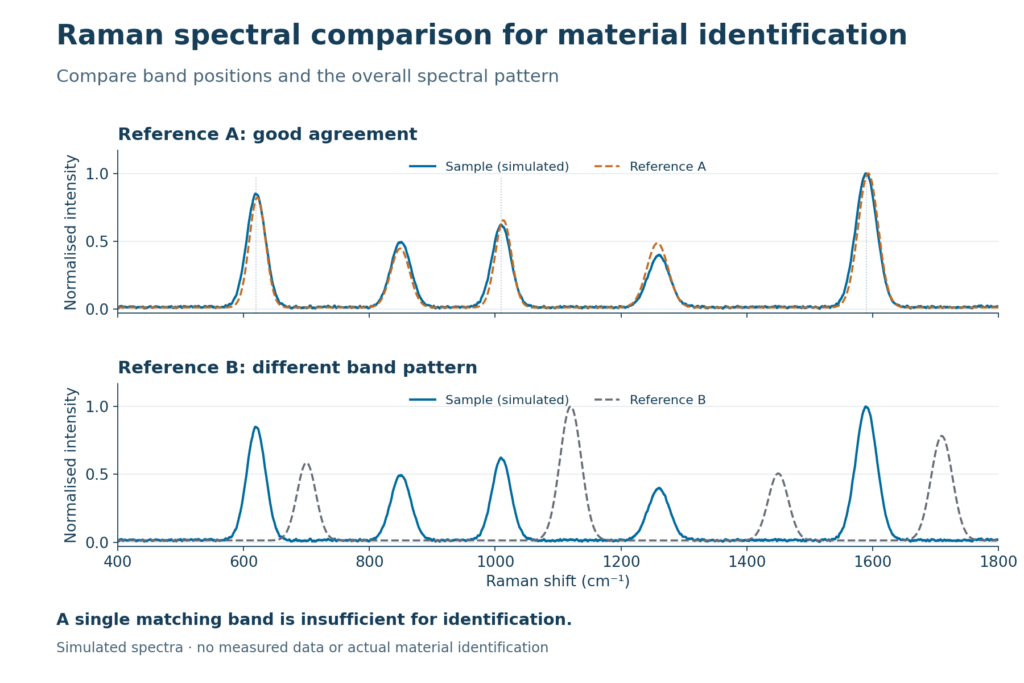
The illustration shows the principle using simulated spectra. It does not show measured data or actual database search results.
Application example: identifying metallic fragments
Metallic fragments can indicate wear or residues from machining. A LIBS classification method covering twelve material classes across aluminium, iron and copper was evaluated with CORALIS. For materials outside these classes, identifying spectral lines can indicate which elements are present.
Which material classes can the method distinguish?
The LIBS method evaluated in the study distinguishes twelve material classes across three base material groups. The diagram shows the reference classes and concentration ranges used in the study. These classes do not constitute a general classification of all alloys.
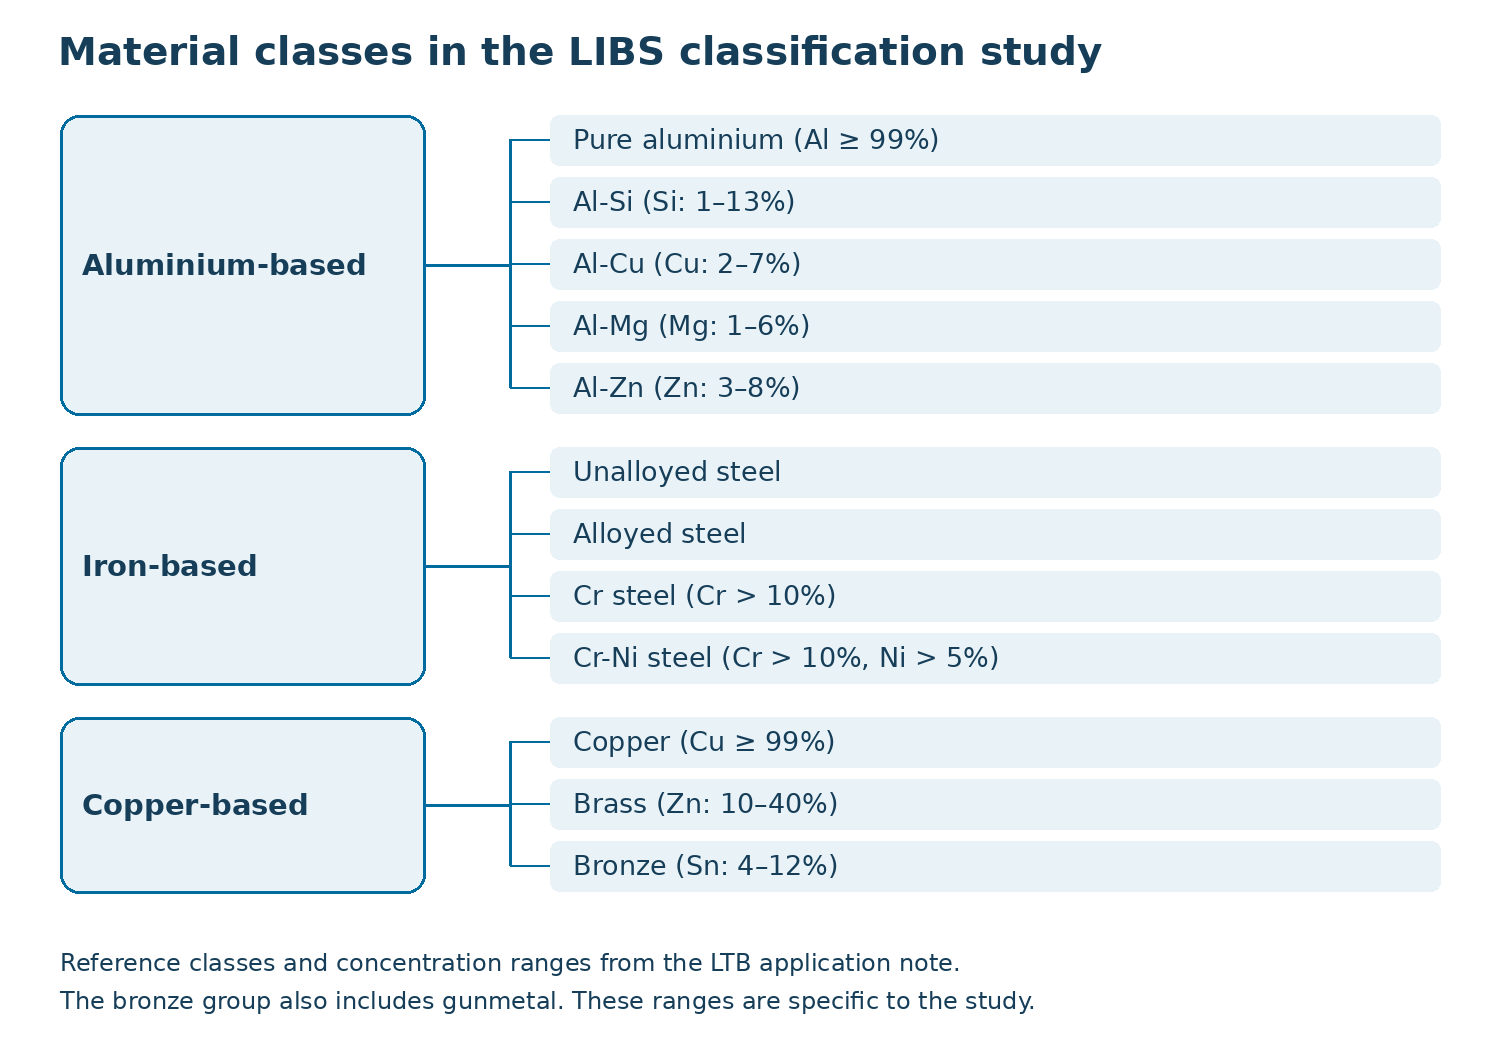
Classification is based on the available reference data. Materials outside the reference classes require further analysis, for example by identifying characteristic spectral lines.
Brass particles below 45 µm
The images below show brass fragments with a Feret diameter of less than 45 µm and the corresponding LIBS spectrum. The spectrum was acquired using two laser pulses at 1,064 nm with a pulse energy of 5 mJ.
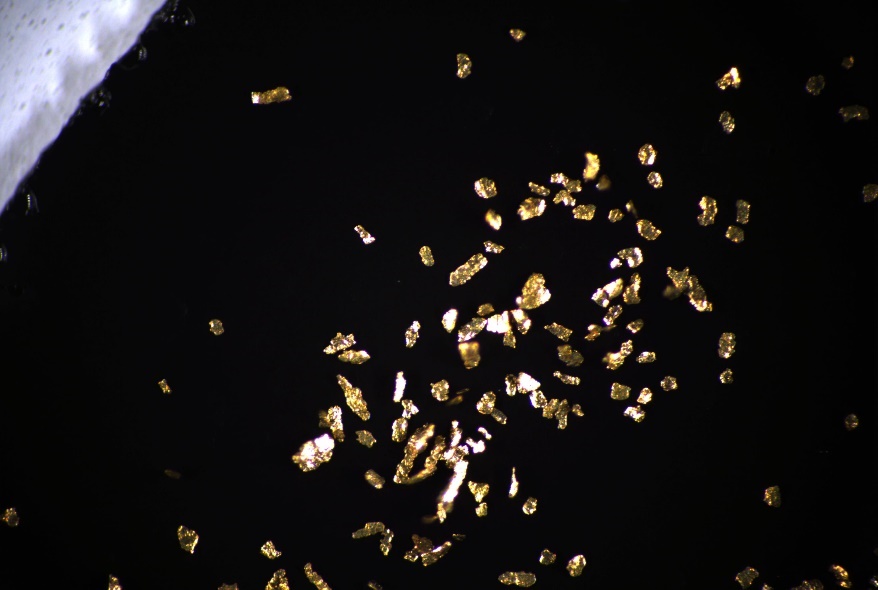
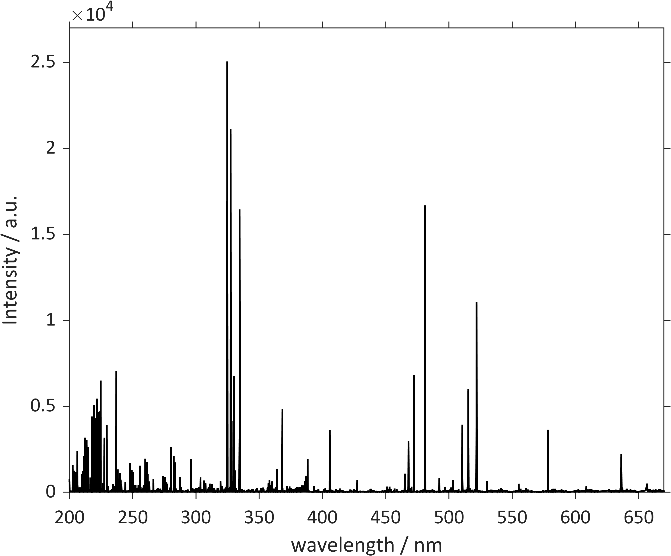
The study examined eleven bulk samples and eight particle samples. Classification rates exceeded 95% for nearly all samples tested. For Al-Si particles below 45 µm, the rate was 86.2%. These results apply to the materials and conditions tested. Spectra with very low intensity were excluded before evaluation. Five fragments per material and size range were measured in each of five independent measurement series.
Particle classification results
| Material | Feret diameter | Correctly classified spectra |
|---|---|---|
| Al-Si | < 45 µm | 86.2% |
| Al-Si | 45–100 µm | 100% |
| Al-Si | 100–250 µm | 100% |
| Brass | < 45 µm | 100% |
| Brass | 100–250 µm | 100% |
| Brass | 500–1,000 µm | 96% |
| Alloyed steel | 100–250 µm | 100% |
| Unalloyed steel | 400–1,000 µm | 96.0% |
Source: V. Merk and L. Pfeifer, LTB application note “Identification of particles with the Raman-LIBS-System CORALIS”, Table 2. Five independent measurement series, with five particles per size range and material in each series. Two laser pulses were used for particles below 45 µm and five for the other size ranges. Spectra with very low intensity were excluded before evaluation. The percentages refer to correctly classified spectra, not to the proportion of all particles detected. The results apply to the samples and measurement conditions tested.
The results show that the classification rate depends on both the material and the size range. For Al-Si particles below 45 µm, the rate was 86.2%; for brass particles in the same size class, it was 100%. These figures do not establish a general success rate for other particles.
Capabilities and limitations of the methods
Optical microscopy and spectroscopy complement each other when characterising selected particles. Results depend on factors such as particle size, material and substrate. Classification requires suitable reference data, and quantitative results require appropriate calibration. LIBS removes material and can alter small particles. Identifying the material can indicate a possible source, but does not establish it on its own.
Is CORALIS right for your measurement task?
CORALIS combines imaging, LIBS and Raman in a single system. Tell us about your sample and what you need to find out, and we can assess a suitable approach together.
Further reading
M. Lanzinger et al.: Development of laser-induced breakdown spectroscopy-methods for rapid element quantification in alloy particles in technical cleanliness analysis. Spectrochimica Acta Part B, 205 (2023), 106691. https://doi.org/10.1016/j.sab.2023.106691
M. Lanzinger et al.: LIBS as a fast and reliable alternative to μXRF and SEM–EDX for quantitative analysis of aluminium alloy particles in technical cleanliness analysis. Microchemical Journal, 207 (2024), 111782. https://doi.org/10.1016/j.microc.2024.111782
L. Pfeifer, V. Merk, S. Damaske and W. Werncke: Kombinierte LIBS- und Ramanspektroskopie zur Partikelanalyse. JOT (2020). https://doi.org/10.1007/s35144-020-0961-0