

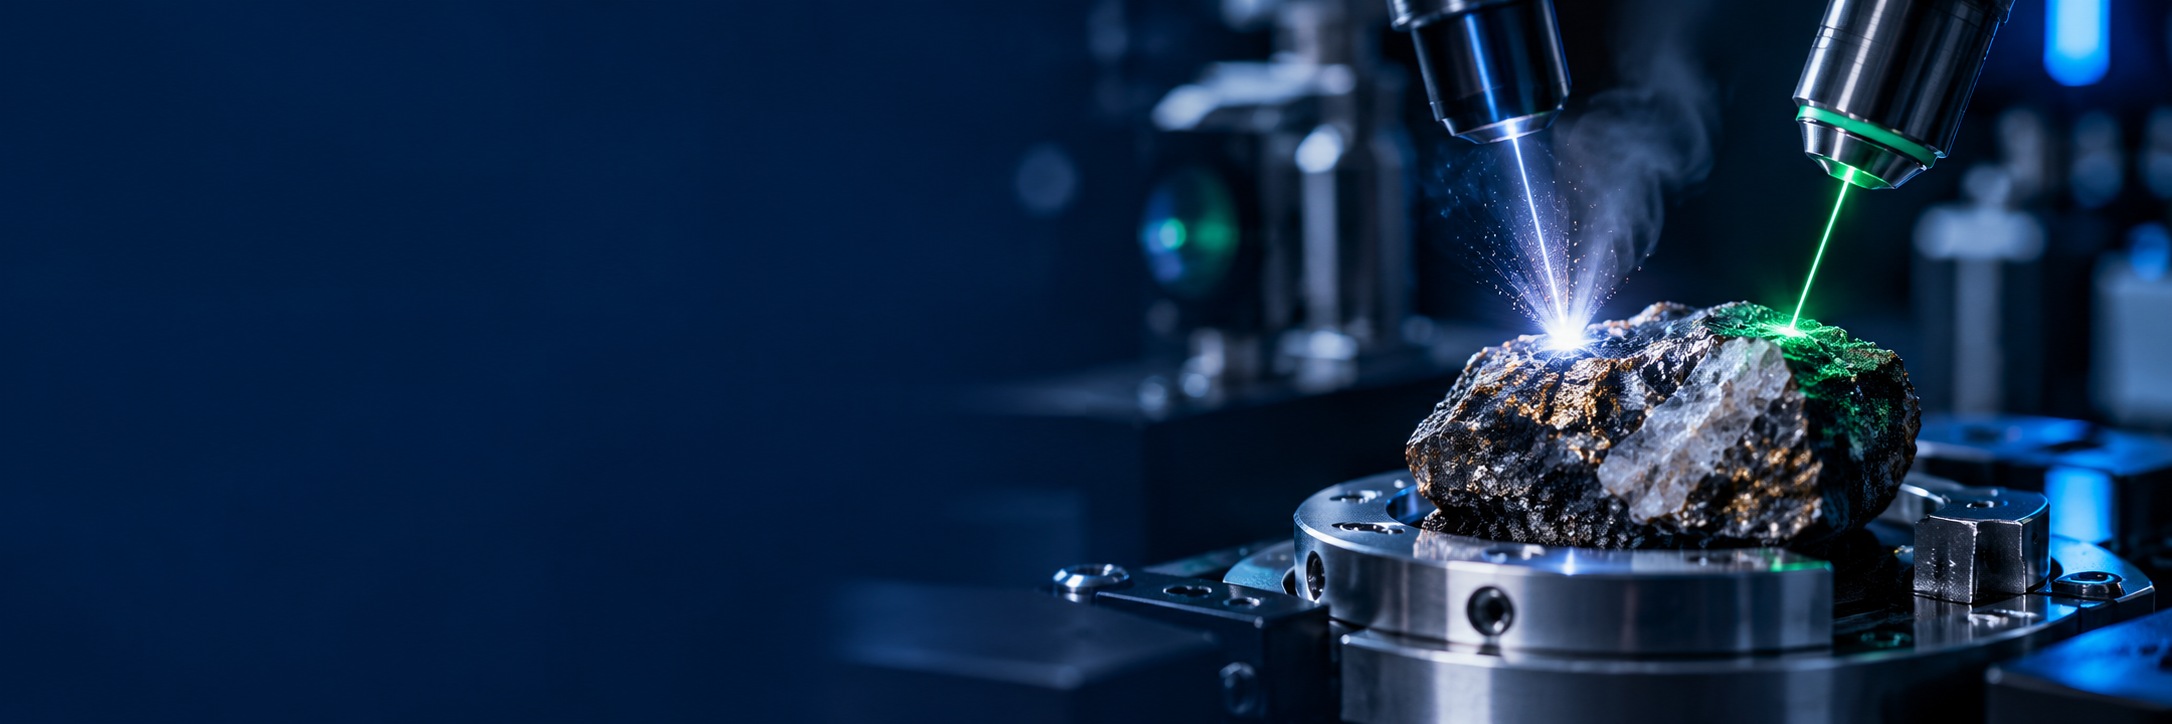
Which elements does a sample contain? And in which compounds or material phases do they occur? The LIBS RAMAN combination brings together elemental analysis and information on chemical bonds and structure. This allows materials to be investigated from two complementary perspectives.
This page explains the benefits of combining these methods, the shared measurement workflow and examples from LTB’s areas of research. You can find the physical principles on our pages on LIBS and Raman spectroscopy.
What information do LIBS and Raman provide?
LIBS: elemental composition
A short laser pulse locally ablates material and generates a plasma. Its emission lines provide information about the elements present. Suitable reference materials and calibration also allow elemental concentrations to be determined.
Raman: bonds and material phases
Inelastic scattering of laser light produces characteristic vibrational spectra. Raman bands can support the identification of compounds and crystalline phases, for example by comparison with reference spectra.
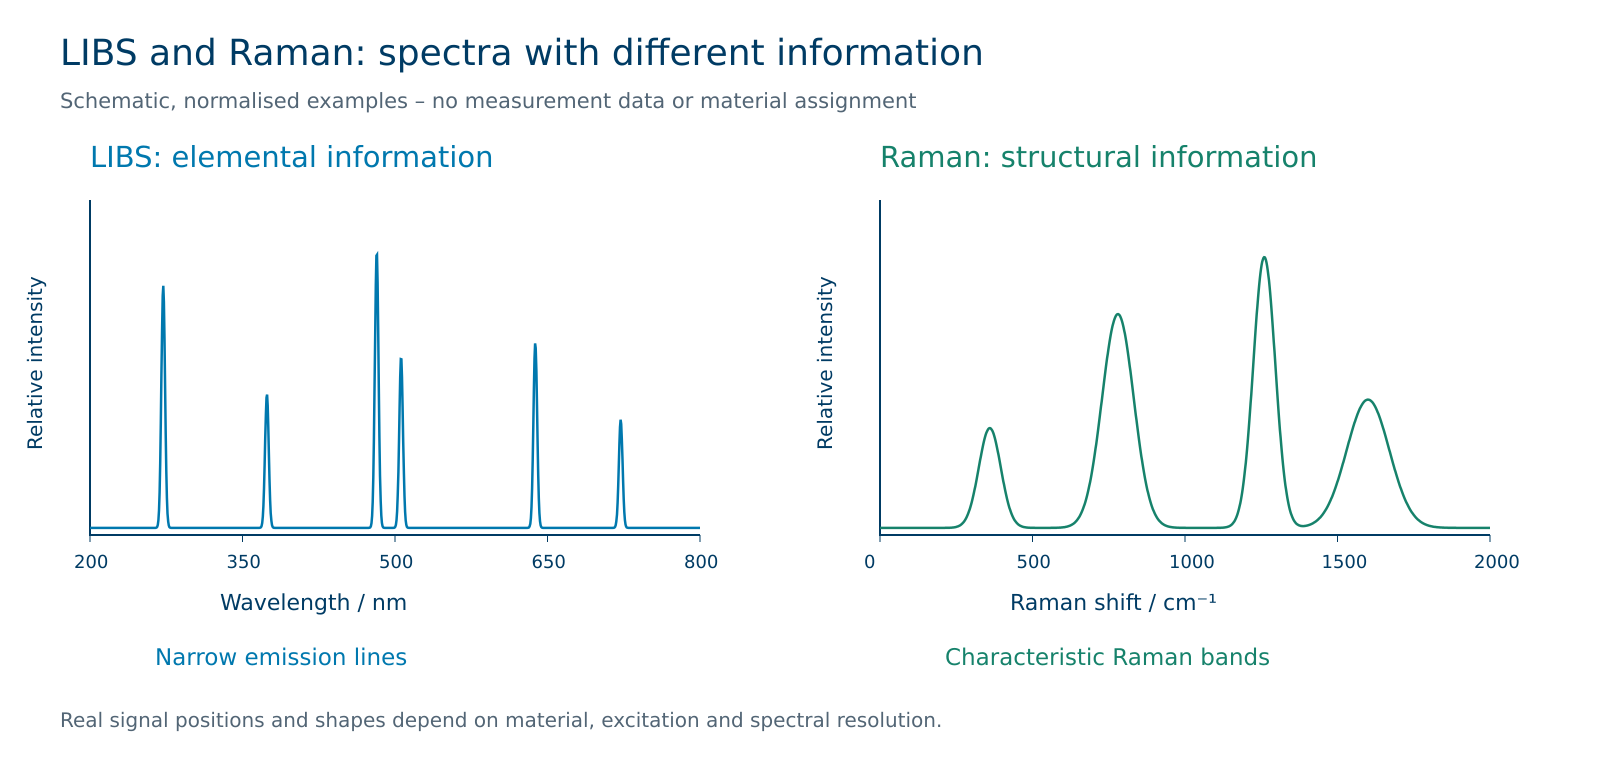
Detecting an element alone often does not identify its chemical compound. For example, detecting calcium may be consistent with several different calcium-containing materials. A suitable Raman spectrum helps narrow down the possible compounds. For mixtures or weak signals, however, the assignment may remain ambiguous.
Why combine LIBS and Raman?
Linking elements and structure
Materials containing similar elements may have different bonds or phases. Considering both methods together adds structural information to the elemental findings.
Assigning measurement positions
A shared sample image supports the selection of individual particles, regions or grids. Findings from both methods can then be assigned to the same selected positions.
Comparing samples systematically
Reference comparisons and multivariate methods can reveal differences between samples. Whether the combination offers an advantage must be assessed for the specific analytical task.
How does combined analysis work?
The workflow starts with the sample image, in which individual measurement points or a grid are defined. If the original surface is to be investigated, Raman is generally measured before LIBS, because LIBS excitation modifies the sample spot. In CORALIS, selected positions can be analysed with either method or sequentially with both. [6]
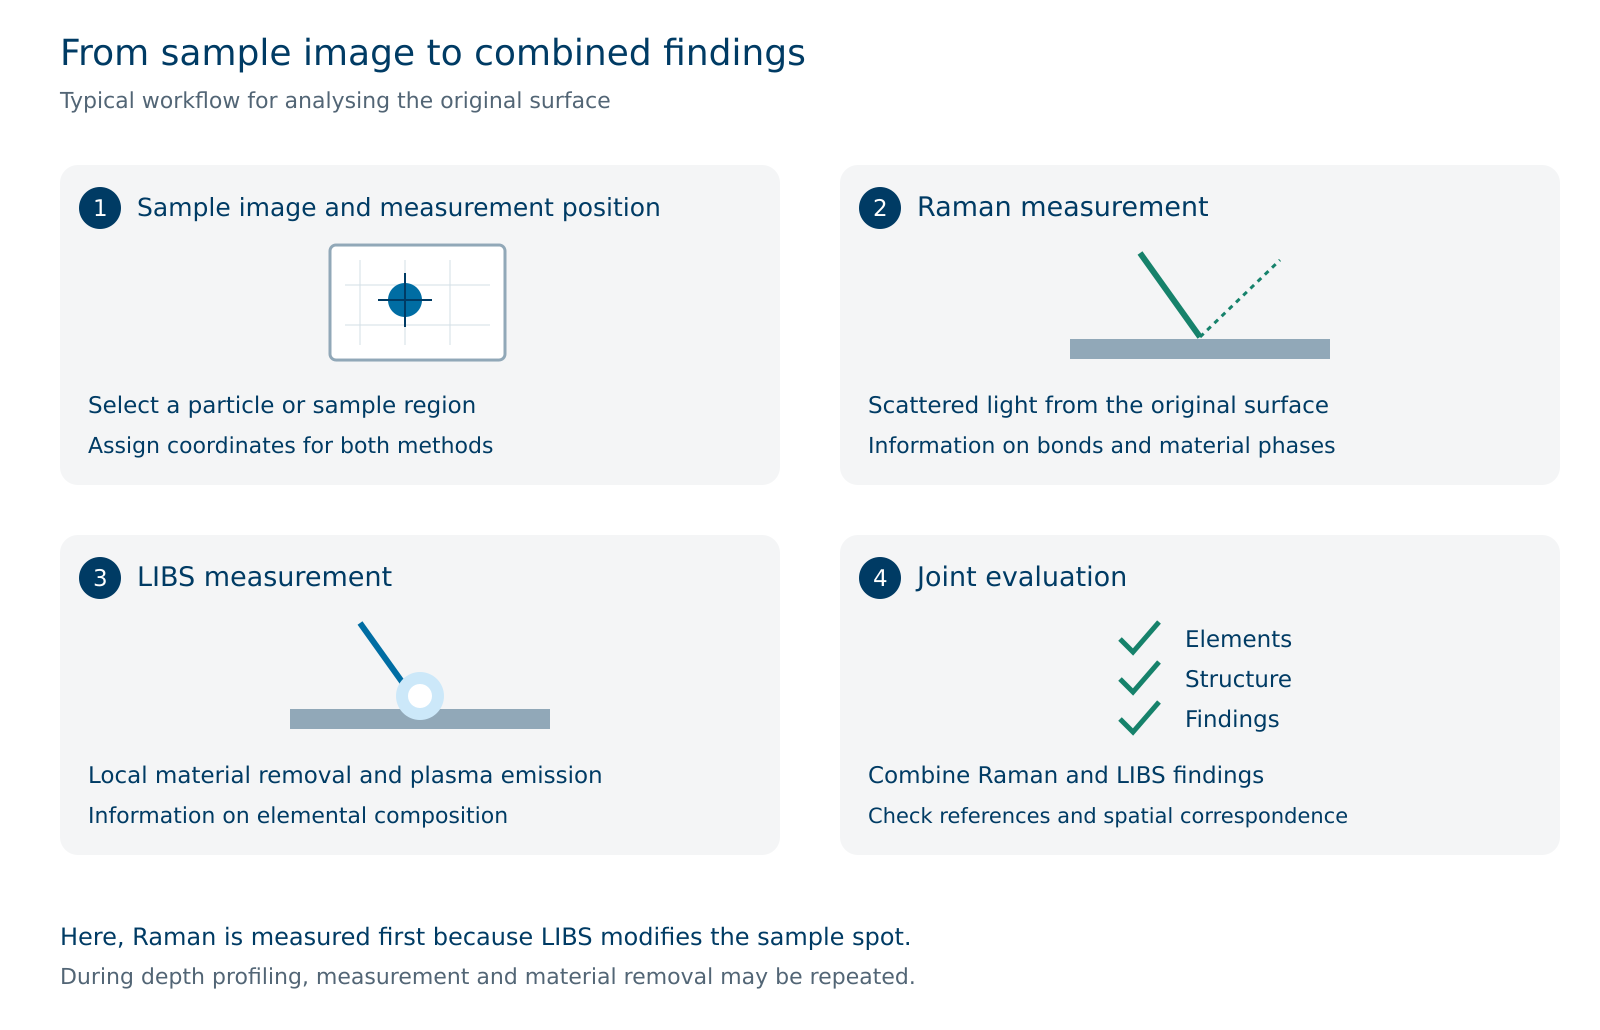
Even when using shared coordinates, the measurement spots and volumes sampled by the two methods are not necessarily identical. This spatial correspondence is particularly important for small particles, thin layers and heterogeneous samples. Spectral preprocessing and reference comparisons are therefore adapted to the sample.
Which applications benefit from the combination?
Technical cleanliness / particle analysis
Sample images show a particle’s position and shape. LIBS adds elemental composition, while Raman can distinguish compounds and phases in suitable materials. Together, these findings provide clues to the material type and possible sources of contamination.
Geological materials
Elemental analysis and Raman-active mineral phases complement each other in the characterisation of rocks and inclusions. Which constituents can be detected depends on factors including the material, excitation wavelength and measurement conditions.
An existing LTB application example is available under Particle analysis and technical cleanliness. The publications and application notes below also describe studies of paint and glass.
Published application examples from LTB research
Automotive paint: chemical profiles along a cross-section
Merk, Werncke and Pfeifer investigated eight multilayer automotive paint samples. Raman and LIBS measurements were performed sequentially at the same positions along the cross-sections. Combined with k-means analysis, this produced profiles of compounds and elements. The study demonstrates an approach to characterising and comparing different paint layer structures. [1]
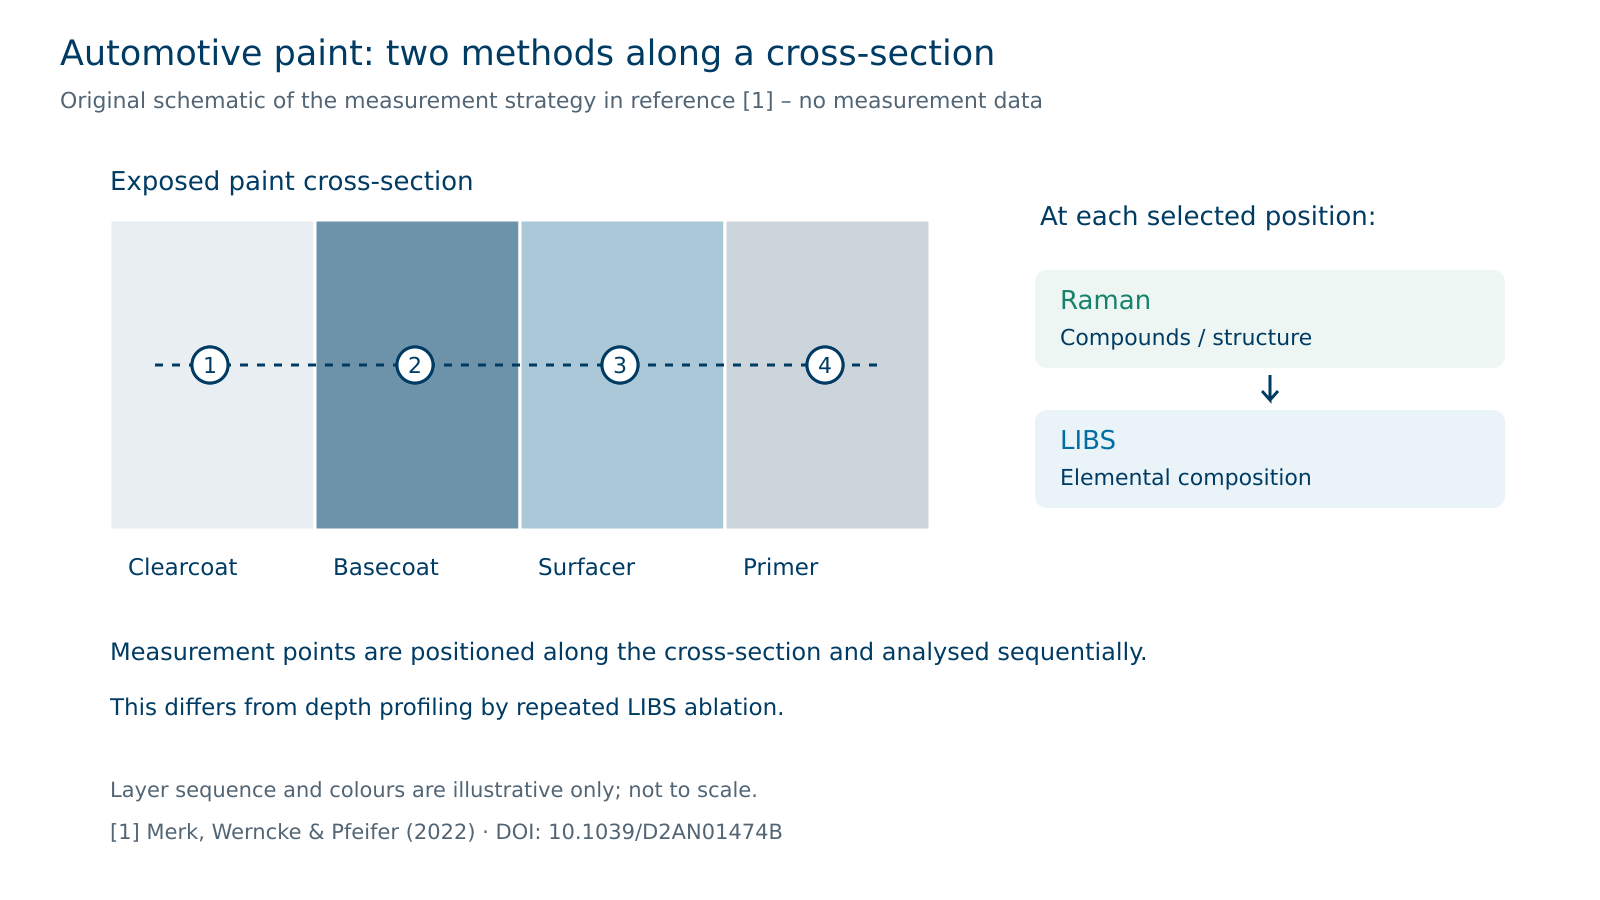
Distinguishing cross-section measurements from depth profiling: Cross-section measurements investigate positions along an exposed cut surface. Depth profiling, in contrast, involves repeated material removal at or around a sample position. The LTB application note on depth scans explains this second strategy and shows that crater geometry and material from the crater walls can affect the assignment of LIBS signals to depth. [4]
Automotive glass: comparing samples using combined spectral data
Merk and co-authors investigated 16 glass samples, predominantly from vehicle glazing, using LIBS, Raman and multivariate analysis. LIBS alone already achieved high discrimination. The additional Raman information increased the distances between sample groups in principal component space. Differences in fluorescence also contributed. [2]
This example shows that fluorescence can hinder Raman band assignment, yet can also carry sample information in a specifically validated classification. The value of data fusion therefore needs to be assessed for the application. Further practical descriptions are provided in the LTB application notes on paint samples and automotive glass. [3] [5]
Strengths and limitations at a glance
| Aspect | LIBS | Raman |
|---|---|---|
| Information | Elemental composition | Bonds, compounds and phases where suitable Raman signals are available |
| Effect on the sample | Local material removal and possible changes in the surrounding area | Often largely non-destructive; heating and sample modification are possible |
| Typical limitations | Matrix effects, overlapping lines and the need for calibration for quantitative results | Fluorescence, weak signals, overlapping bands and the need for references |
| Joint assessment | Check elemental findings and calibration | Add structural findings and reference comparisons |
LIBS-RAMAN combined analysis is not completely non-destructive because LIBS removes material. The absence of a signal does not rule out a constituent. Nor does combining the methods automatically provide unambiguous identification or improved classification for every sample. Measurement conditions, references and suitable validation are essential.
How does LTB implement the combination?
Imaging and positioning
CORALIS combines optical sample imaging with measurement position selection and precise sample positioning. Depending on the task, individual points or larger regions can be investigated.
ARYELLE echelle spectroscopy
An ARYELLE echelle spectrometer forms the spectroscopic core of the system. The combination of high spectral resolution and a broad wavelength range supports the acquisition of Raman and LIBS signals.
The CORALIS documentation also describes instrument control and evaluation with FusionRL, reference comparisons and multivariate analysis methods. The appropriate functions and measurement parameters are selected according to the sample and system configuration. [6]
Further information: CORALIS and Echelle spectrometers.
Frequently asked questions about combined LIBS–Raman analysis
Are Raman and LIBS measurements performed simultaneously?
In the CORALIS workflow described here, the methods are used sequentially at selected sample positions. Combining the methods does not automatically mean simultaneous excitation or acquisition.
Why is Raman often measured first?
To obtain a Raman spectrum of the original surface. LIBS removes material and can modify the measurement spot. For targeted investigations of deeper layers, a workflow involving repeated ablation followed by further measurements may be useful.
Is sample preparation required?
Many samples can be investigated with little preparation. Positioning, fixing the sample or exposing a cross-section may nevertheless be necessary. Cross-section analysis should be distinguished from depth profiling by laser ablation.
Can I determine concentrations and compounds?
LIBS enables quantitative elemental analysis with suitable calibration. Raman supports the assignment of compounds and phases using characteristic spectra. This does not automatically provide quantitative determination of molecular fractions.
Does the combination always improve material identification?
No. The additional information depends on the material and the analytical task. Data fusion and classification models must be evaluated using suitable samples and independent test data.
References and further reading
The following articles and LTB documents support the practical examples described above. Journal publications and manufacturer application notes are listed separately.
Scientific journal publications
[1] Virginia Merk, Wolfgang Werncke and Lutz Pfeifer (2022). Cross-section measurements of multilayer automotive paint samples using combined Raman spectroscopy and LIBS. Analyst, 147, 5470–5476. DOI: 10.1039/D2AN01474B
[2] Virginia Merk, Dominik Huber, Lutz Pfeifer, Saskia Damaske, Sven Merk, Wolfgang Werncke and Michael Schuster (2021). Discrimination of automotive glass by conjoint Raman and laser-induced breakdown spectroscopy and multivariate data analysis. Spectrochimica Acta Part B: Atomic Spectroscopy, 180, 106198. DOI: 10.1016/j.sab.2021.106198
LTB application notes and system documentation
[3] Lutz Pfeifer, Saskia Damaske and Wolfgang Werncke (n.d.). Investigation of Car Paint Coatings with the Combined Raman LIBS System CORALIS. LTB Lasertechnik Berlin, Application Note – Forensics 1. Application note (PDF)
[4] Lutz Pfeifer, Saskia Damaske, Wolfgang Werncke and Virginia Merk (n.d.). Depth scans on car paint samples with Raman spectroscopy and LIBS. LTB Lasertechnik Berlin, Application Note – Forensics 2. Application note (PDF)
[5] Saskia Damaske, Wolfgang Werncke, Virginia Merk and Lutz Pfeifer (n.d.). Investigation of Automotive Glass with the Combined Raman/fluorescence and LIBS System, CORALIS. LTB Lasertechnik Berlin, Application Note – Forensics 3. Application note (PDF)
[6] LTB Lasertechnik Berlin (n.d.). CORALIS – Combined Raman LIBS System. Product brochure. Product brochure (PDF)
The configurations and results described in the publications relate to the samples and system configurations investigated in those studies.
The right solution for your analytical task
Would you like to investigate particles, layers or other materials using LIBS and Raman? LTB can help you assess the additional information that combining the methods could provide for your sample and define a suitable measurement strategy.