

From the light of a flame to the depth profile of a coating. Optical emission spectroscopy analyses the light emitted by excited atoms, ions or molecules. Depending on the application, the spectrum can reveal a sample’s composition, changes in a plasma or the structure of a coating. The information it provides depends on how the species are excited and how the emitted light is measured.
How does optical emission spectroscopy work?
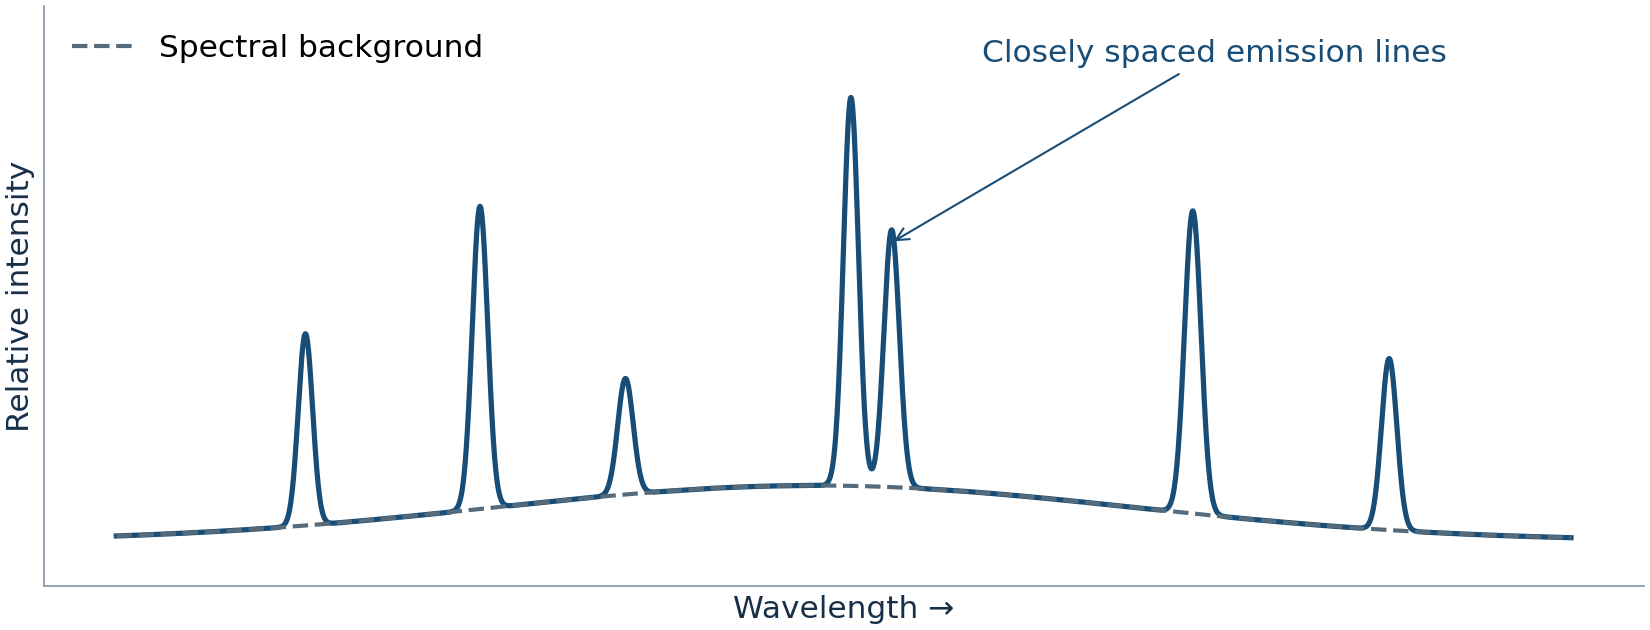
A flame, a plasma or an electrical discharge excites atoms, ions or molecules. As they transition to a lower energy state, they can emit light. Atoms and ions produce characteristic spectral lines. Molecules can produce groups of closely spaced lines that appear as bands. Collection optics capture the light and guide it to the spectrometer through an optical fibre or a free-space optical path. The spectrometer separates the light by wavelength and a detector records the spectrum.
What information does OES provide?
Identify and quantify elements
The wavelength of a suitable line helps identify the emitting element. Quantifying its concentration generally requires calibration against suitable standards and accounting for the spectral background, sample matrix and overlapping lines.
Study processes and material layers
Recording a series of spectra makes it possible to track changes in emission lines and bands. In a process plasma, these changes can indicate shifts in the species present or in their excitation conditions. In GD-OES, a series of spectra reveals how composition changes as material is removed.
Flame, continuous plasma and glow discharge
Flame OES
In conventional flame emission spectroscopy, a liquid sample is usually nebulised and introduced into the flame as an aerosol. Free atoms form in the flame and are thermally excited. The technique is particularly suitable for elements that are easily excited, such as sodium and potassium. Combustion diagnostics can also use light emitted by the flame itself. For example, emission bands from excited OH and CH radicals can help locate the reaction zone.
OES with continuously operated plasmas
Inductively coupled plasma optical emission spectroscopy (ICP-OES) is one example used for elemental analysis. The sample, usually a liquid, is introduced as an aerosol into an inductively coupled argon plasma. Characteristic emission lines from excited atoms and ions allow multiple elements to be determined.
Process plasma diagnostics uses light from the plasma already present in a process, such as coating or etching. Tracking selected lines or bands over time can reveal changes in the process. Line intensities depend on both the abundance of the emitting species and their excitation conditions.
Glow discharge optical emission spectroscopy (GD-OES)
In a low-pressure glow discharge, ions, typically argon ions, bombard a solid sample and sputter material from its surface. The released atoms are excited in the discharge, and their emission is recorded throughout sputtering. This reveals transitions between coatings and the underlying material. Quantitative concentration depth profiles require calibration of the emission intensities and a material-specific conversion from sputtering time to depth.
OES techniques at a glance
| Technique | Typical application | Measurement considerations |
|---|---|---|
| Flame OES | Determine easily excited elements in solution or monitor flame emission. | Suitable lines or bands and reproducible observation conditions. |
| Continuous plasma OES | Determine multiple elements in samples (e.g. ICP-OES) or monitor changes in a process plasma. | Suitable analytical lines and calibration for elemental analysis, plus a suitable sampling rate for process diagnostics. |
| GD-OES | Examine the distribution of elements in coatings and near-surface regions. | Repeated acquisition during sputtering and calibration for quantitative depth profiles. |
| LIBS | Analyse solids locally at individual points or across a measurement grid. | Synchronise the detection window with the laser pulse and the evolution of the short-lived plasma. |
Laser-induced breakdown spectroscopy (LIBS) is also an OES technique. A short laser pulse creates a plasma at the measurement spot, enabling spatially resolved analysis of individual particles or material surfaces.
When is an echelle spectrometer useful?
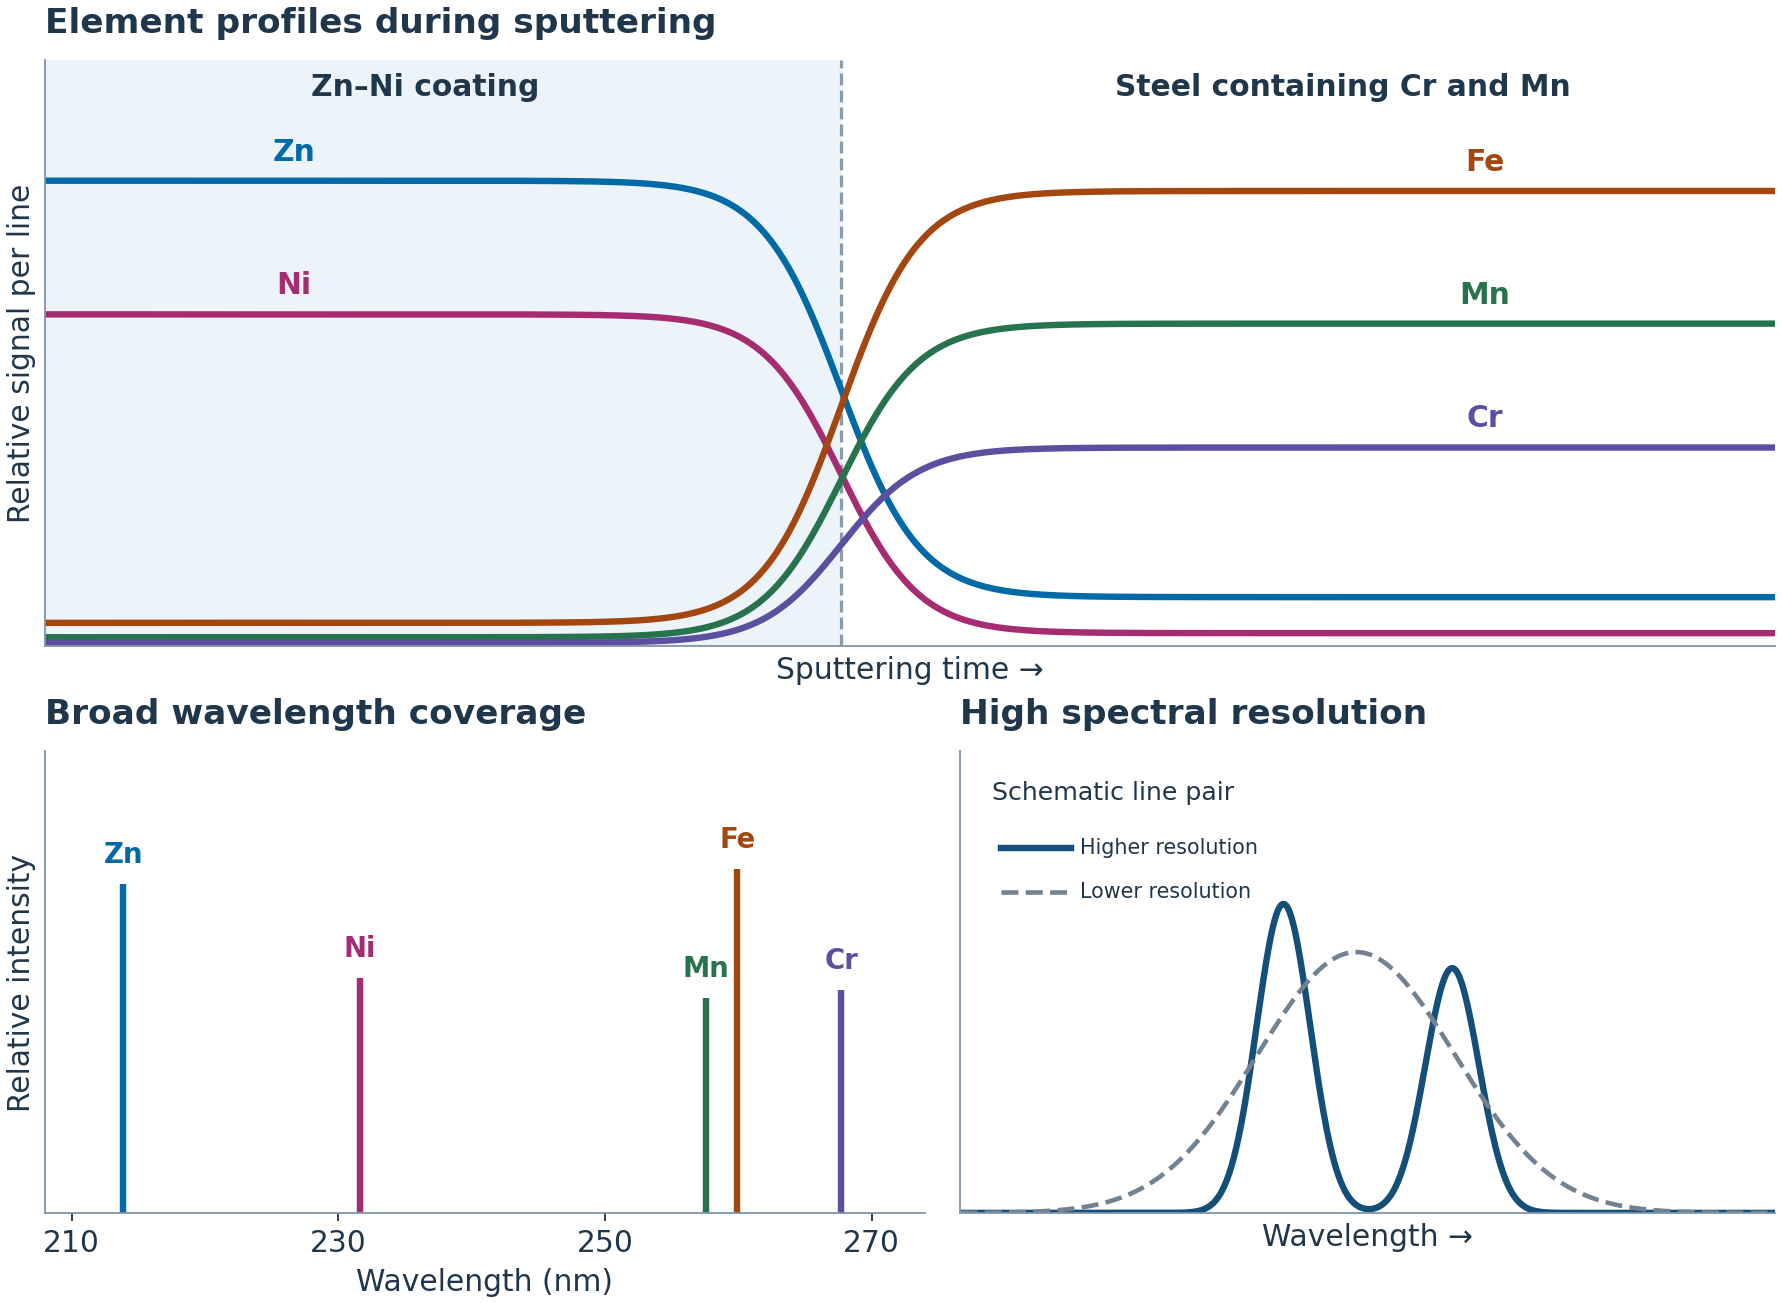
Echelle spectroscopy combines broad simultaneous wavelength coverage with high spectral resolution. This is useful when a measurement needs to capture many lines at once or separate closely spaced signals. In an echelle spectrograph, a cross-disperser separates overlapping diffraction orders across an area detector. A single acquisition can then include multiple lines per element, reference lines and spectral regions for background correction, provided they lie within the recorded wavelength range.
When depth profiling a zinc–nickel coating with GD-OES, an echelle spectrometer can record the zinc and nickel lines alongside those of iron, manganese and chromium. As sputtering continuously removes material from the surface, simultaneous acquisition means all five signals correspond to the same point in the sputtering process.
Select the spectrometer and detection setup based on the target wavelengths, the smallest line separation of interest, optical throughput, dynamic range and acquisition rate. In the deep UV, the entire optical path must transmit the wavelengths of interest, from the source window and coupling optics to the detector. For weak or rapidly changing signals, light collection, detector choice and exposure time all matter.
Echelle spectrometers for your OES setup
LTB has supplied echelle spectrometers for flame OES, continuous plasma OES and GD-OES. ARYELLE spectrographs record the emission spectra in these setups. The appropriate configuration depends on the wavelength range, spectral resolution and coupling to the existing source.
ARYELLE 200
Compact echelle spectrograph for simultaneous acquisition across a broad wavelength range, for example in multi-element analysis or when monitoring several plasma emission lines.
ARYELLE 400
Echelle spectrograph with higher resolving power for applications involving closely spaced emission lines and complex spectra.
ARYELLE Butterfly
Dual echelle spectrograph with two optical channels in one housing for simultaneous measurements across different wavelength ranges.
Frequently asked questions about optical emission spectroscopy
Can OES determine concentrations directly from line intensity?
Quantitative analysis generally requires calibration. At a given concentration, line intensity can vary with plasma conditions, matrix effects or self-absorption. Suitable reference samples and lines with minimal interference are important when developing the method.
Can an echelle spectrometer be coupled to an existing plasma source?
Depending on the setup, light can be coupled via an optical fibre or free-space optics. The choice depends on the source geometry and optical window, the wavelength range of interest, the available light and the required acquisition rate.
What is the difference between spectral and temporal resolution?
Spectral resolution describes how close two emission lines can be while remaining distinguishable. Temporal resolution describes how quickly changes in emission can be tracked. It depends in part on exposure time, detector readout speed and synchronisation.
Discuss your OES application
Are you planning an OES setup or looking to add spectral detection to an existing source? Share your target wavelengths, expected signal levels and acquisition rate so we can help identify a suitable configuration.